> ## Documentation Index
> Fetch the complete documentation index at: https://razorpay-881012b3.mintlify.site/llms.txt
> Use this file to discover all available pages before exploring further.
# Custom Views
> Custom Views in the Analytics suite lets you build, plot and track the metrics that matter to your business. Save up to five views and monitor them daily.
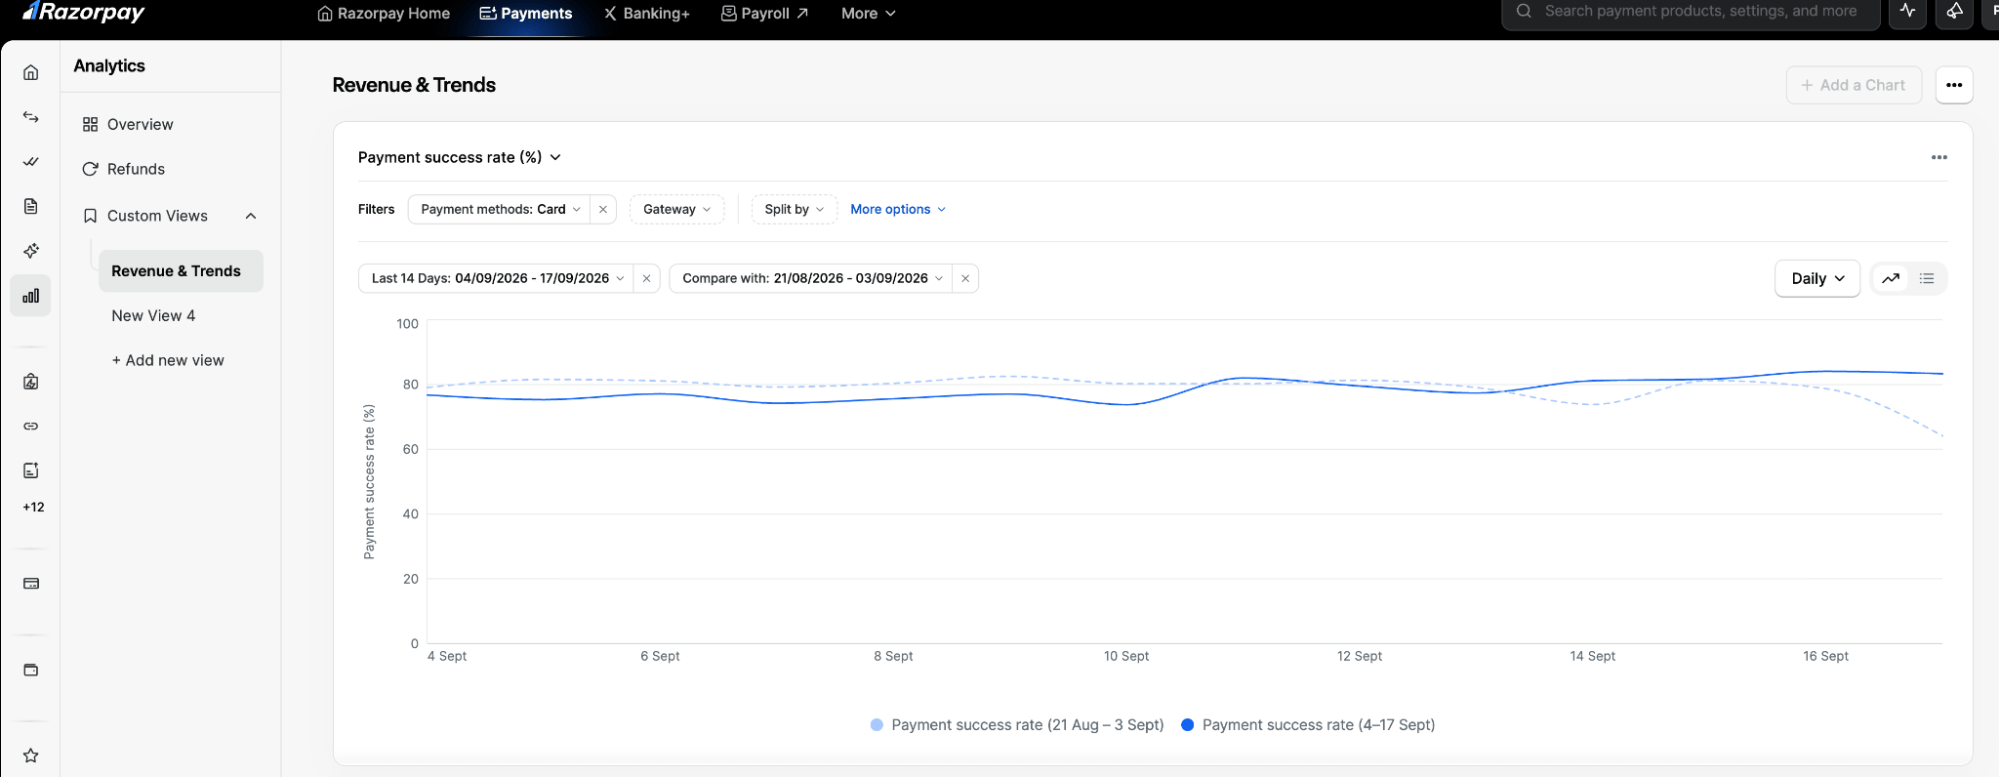
Custom Views lets you build, plot and track the metrics that matter to your business. Create a view for any area you want to track, like success rate, refunds or sales, and add the metrics you want to monitor within it. For example, plot payment success rate for Visa and Mastercard over the last 7 days.
Create up to **5 views**, with **3 charts** each, giving you up to **15 metrics** to track at once.
 ## Set Up Custom Views
### Open Custom Views
In the Dashboard menu, go to **Analytics**. Custom Views sits next to **Overview** and **Refunds** in Analytics.
Every saved view appears in the menu under **Custom Views**. Click a view to open it, or click **+ Add new view** to start a blank one.
## Set Up Custom Views
### Open Custom Views
In the Dashboard menu, go to **Analytics**. Custom Views sits next to **Overview** and **Refunds** in Analytics.
Every saved view appears in the menu under **Custom Views**. Click a view to open it, or click **+ Add new view** to start a blank one.
 ### Build a Chart
Follow the steps below to build a chart:
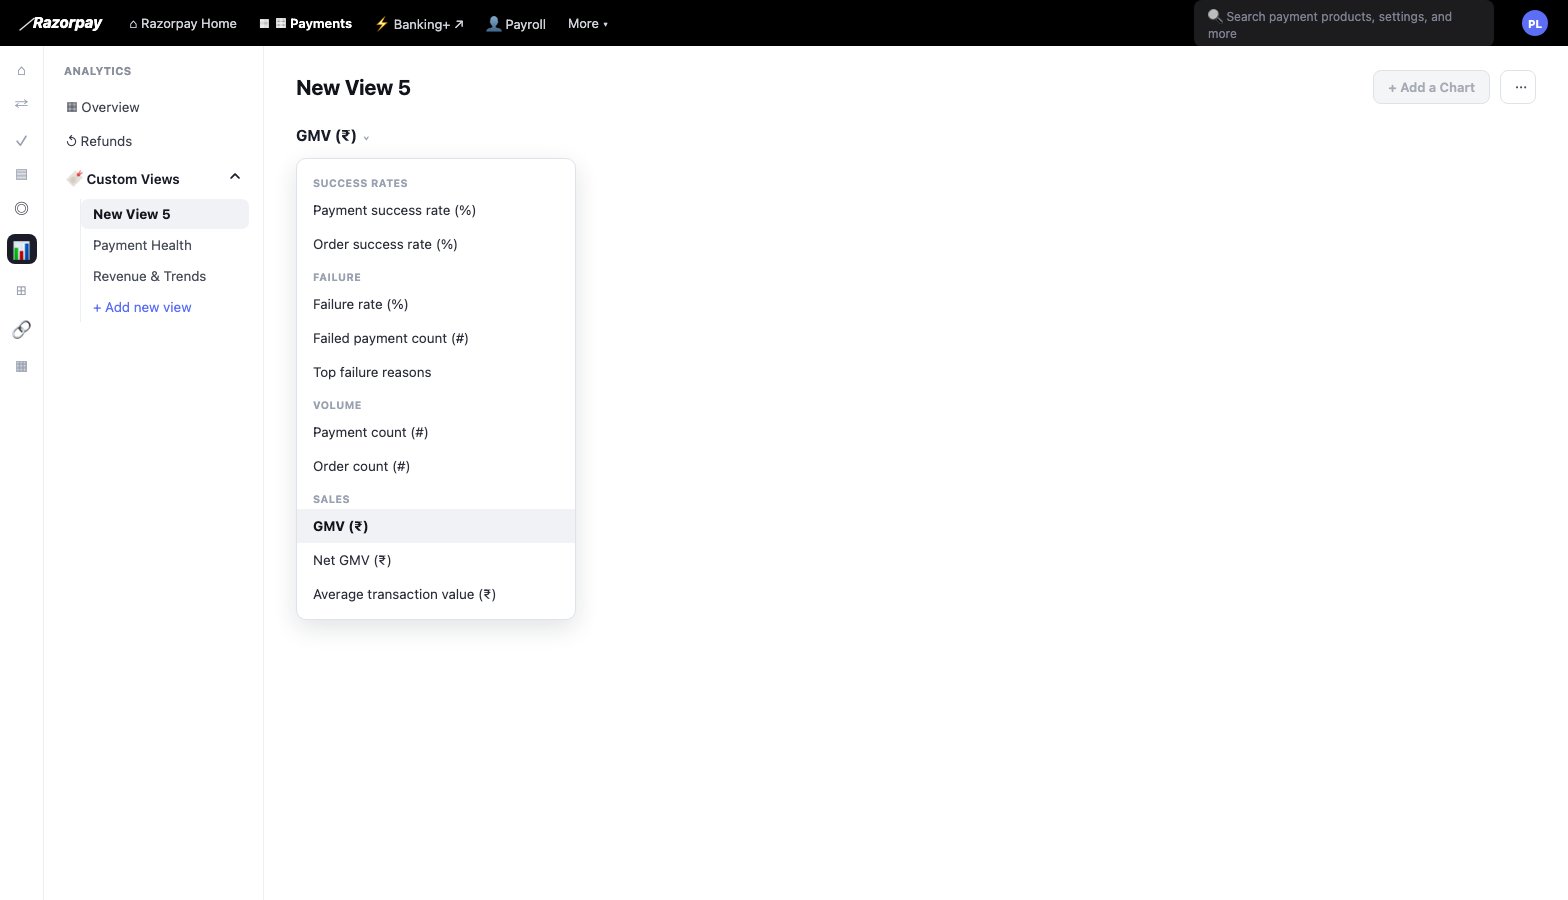
1. **Choose a metric:** Click the metric name at the top of a chart to pick a metric. Metrics are grouped into 5 categories: Success Rates, Volume, Sales, Failures and Refunds.
2. **Add filters:** Up to 3. Values within one filter combine with **OR**. Different filters combine with **AND**. Click **More Options → Show all** to see every dimension.
3. **Choose how to split:** Split the chart with up to 2 parameters. Each combination becomes its own line, bar or table column.
4. **Pick a time range:** Up to 90 days, grouped by hour, day, week or month.
5. **Compare with an earlier period:** Choose **Previous period** or a custom date range.
### Build a Chart
Follow the steps below to build a chart:
1. **Choose a metric:** Click the metric name at the top of a chart to pick a metric. Metrics are grouped into 5 categories: Success Rates, Volume, Sales, Failures and Refunds.
2. **Add filters:** Up to 3. Values within one filter combine with **OR**. Different filters combine with **AND**. Click **More Options → Show all** to see every dimension.
3. **Choose how to split:** Split the chart with up to 2 parameters. Each combination becomes its own line, bar or table column.
4. **Pick a time range:** Up to 90 days, grouped by hour, day, week or month.
5. **Compare with an earlier period:** Choose **Previous period** or a custom date range.
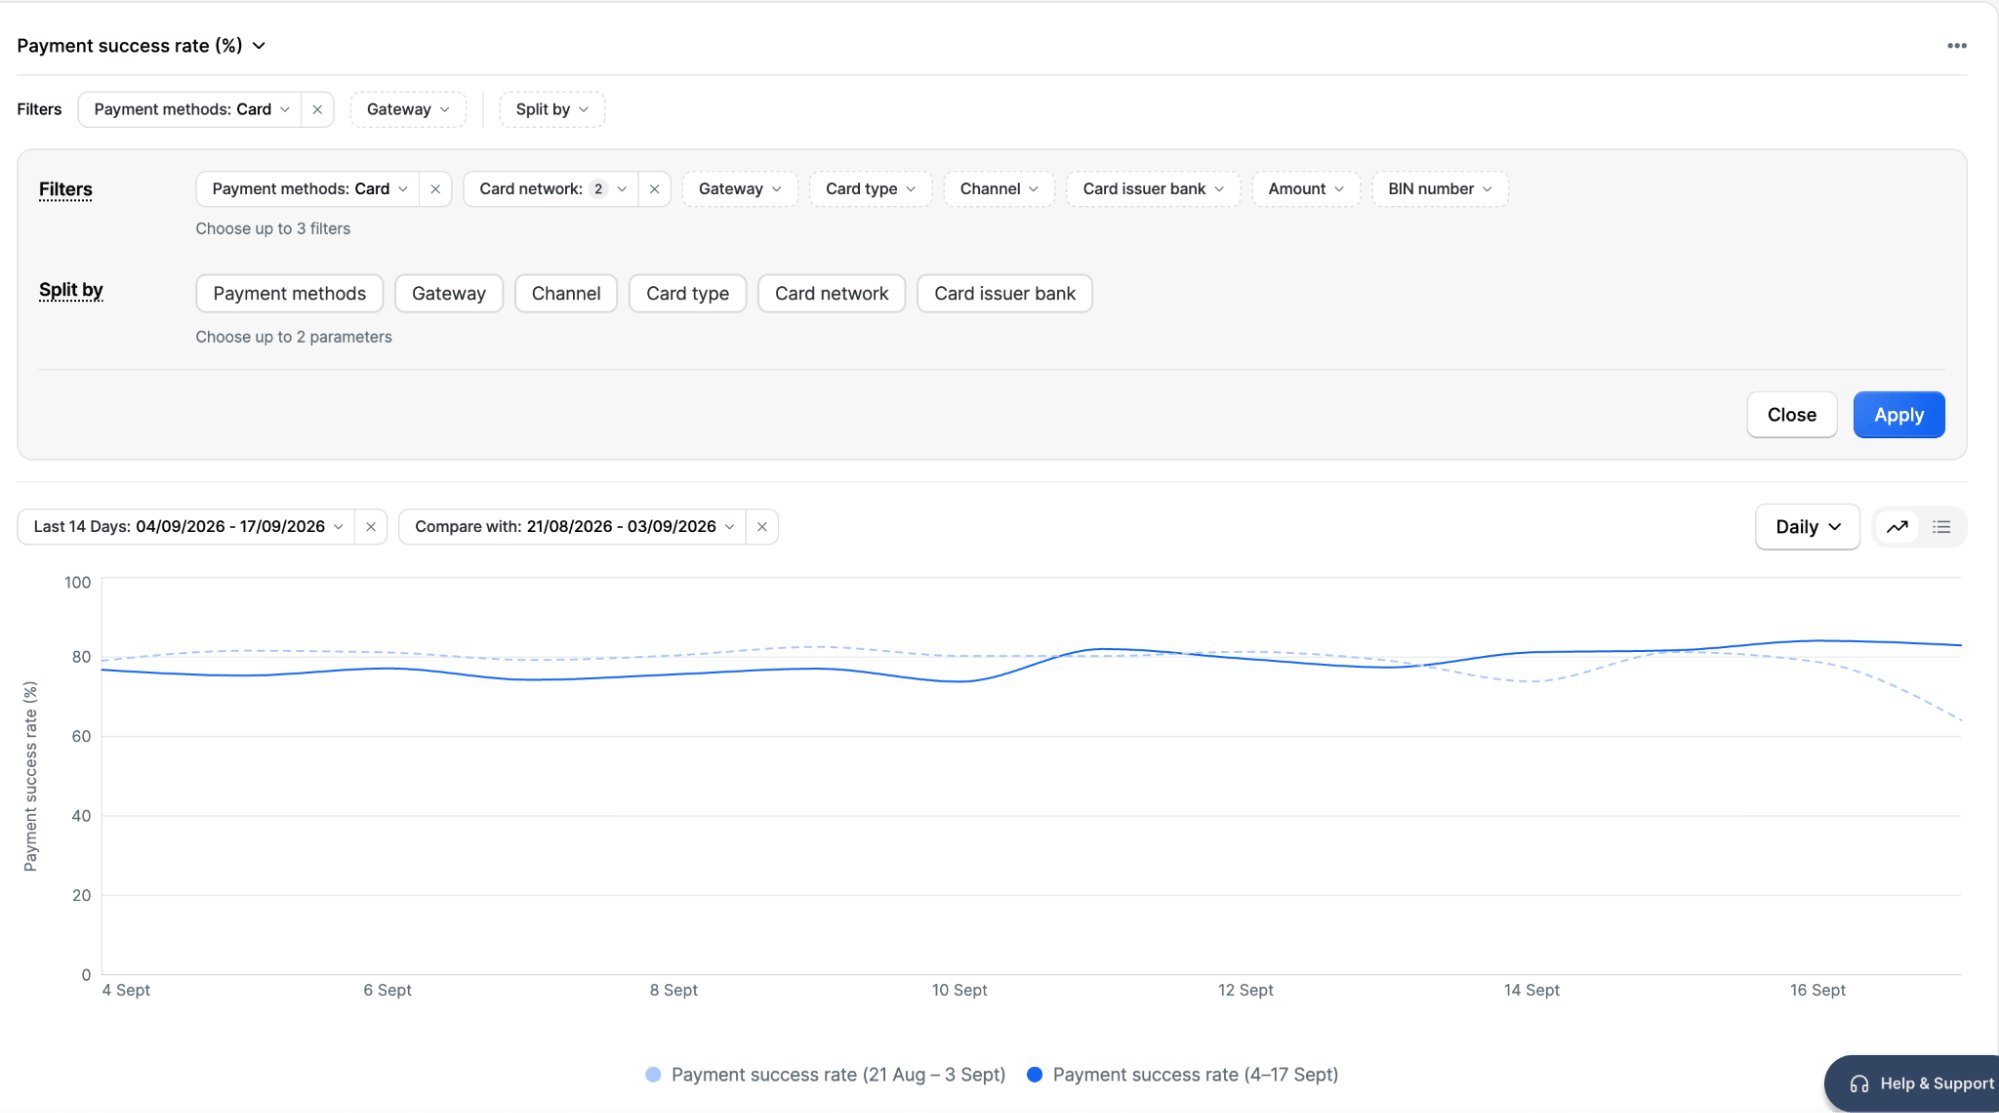 The panel adjusts its suggestions based on what you have already picked. For example, choosing UPI under Payment Methods narrows your split options to UPI-only dimensions like Channel and UPI Flow. Card-only dimensions are removed, so you do not end up with an empty or misleading chart.
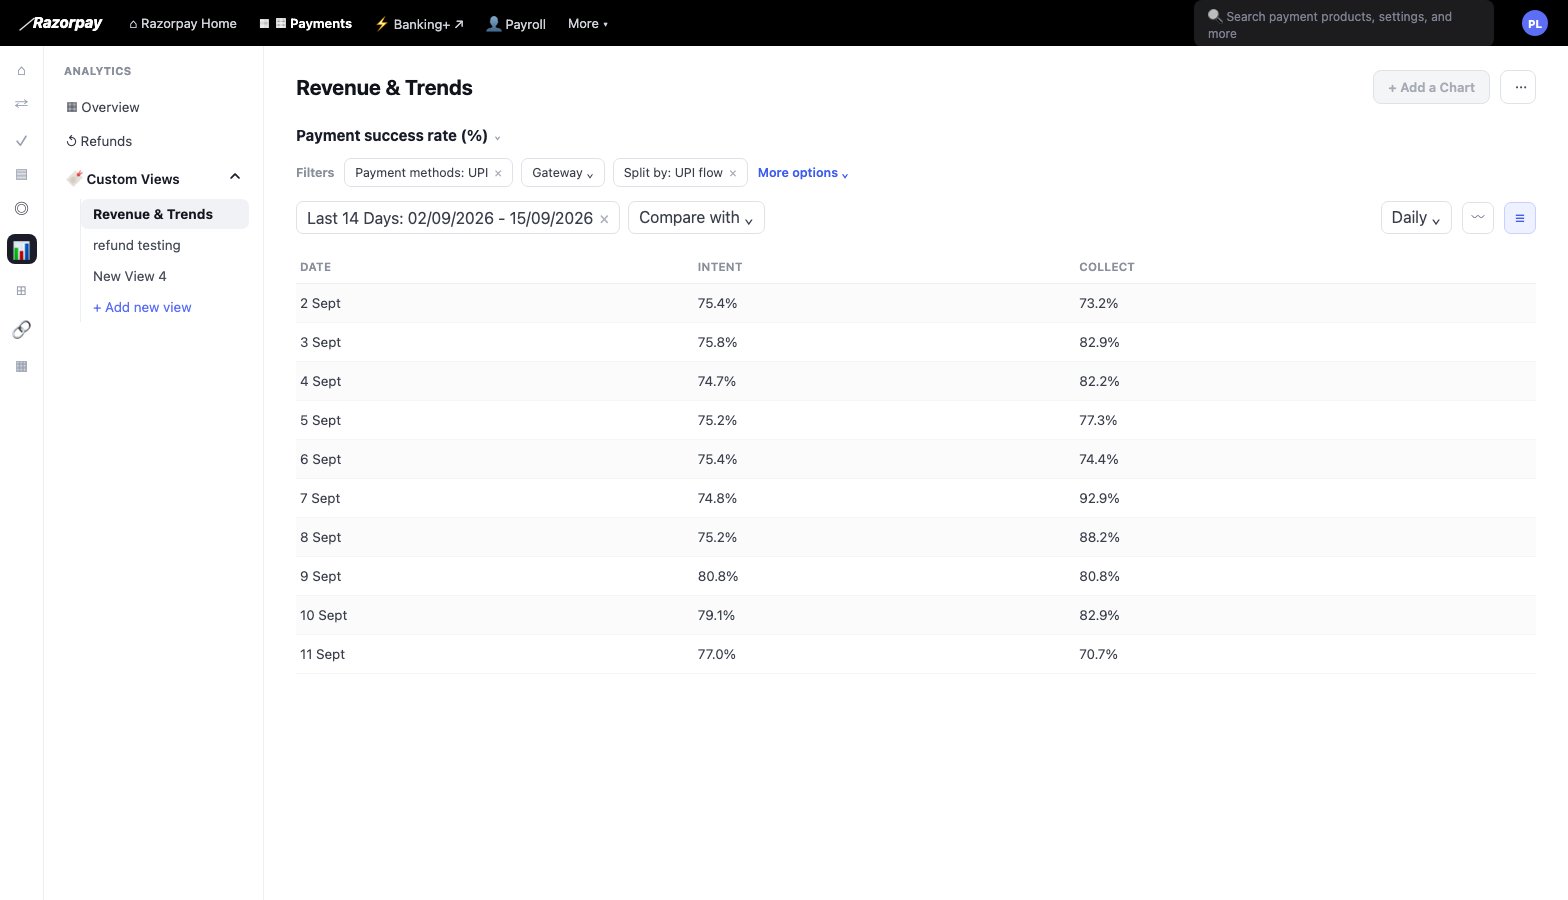
Switch how a chart renders with the icons next to the date range: **Trend line**, **Bar chart** or **Data table**.
The panel adjusts its suggestions based on what you have already picked. For example, choosing UPI under Payment Methods narrows your split options to UPI-only dimensions like Channel and UPI Flow. Card-only dimensions are removed, so you do not end up with an empty or misleading chart.
Switch how a chart renders with the icons next to the date range: **Trend line**, **Bar chart** or **Data table**.
 ### Metrics Supported
The table below lists the metrics you can plot, grouped by category:
| Category | Metric | Definition |
| :---------------- | :---------------------------- | :-------------------------------------------------------------------------------------------------------------------------------------------------------------------------------------------------------- |
| **Success rates** | Payment success rate (%) | Percentage of payment attempts that were successfully authorised. |
| | Order success rate (%) | Percentage of attempted orders that resulted in a successful payment. Each order is counted once, regardless of retries. |
| **Volume** | Payment count (#) | Total payment attempts in the selected period, including retries on the same order. |
| | Order count (#) | Total orders where at least one payment was attempted. Each order is counted once, even if your customer retried the payment. See [Orders](/docs/payments/orders.mdx) and [Payments](/docs/payments.mdx). |
| **Sales** | GMV (₹) | Total value of orders with a payment successfully authorised in the selected period. |
| | Net GMV (₹) | GMV net of refunds for payments in the selected period. |
| | Average transaction value (₹) | GMV divided by total transactions. Shows your average successful payment amount. |
| **Failures** | Payment failure rate (%) | Percentage of payment attempts that failed. |
| | Failed payment count (#) | Number of payment attempts that failed. |
| | Top payment failure reasons | Top 5 most common error reasons across failed payments in the selected period. |
| **Refunds** | Refund rate (%) | Share of payments authorised in the selected period that have been refunded. |
| | Refund count (#) | Refund transactions initiated in the selected period. |
| | Refund amount (₹) | Total value of refunds created in the selected period. Includes failed, pending and processed refunds. |
Order-level metrics take their attributes from the order's latest payment attempt. If a customer tries UPI twice and then pays by card, that order counts as a card payment.
### Filters and Splits
The table below lists the dimensions available as filters and splits:
| Dimension | Filter | Split | Notes |
| :------------------------------- | :----: | :---: | :------------------------------------------- |
| Payment Methods | ✓ | ✓ | — |
| Gateway | ✓ | ✓ | Applicable only for merchants on Optimizer. |
| Channel | ✓ | ✓ | Website, Android and iOS channels supported. |
| Card Type | ✓ | ✓ | — |
| Card Network | ✓ | ✓ | — |
| Card Issuer | ✓ | ✓ | — |
| Netbanking Bank | ✓ | ✓ | — |
| UPI Flow | ✓ | ✓ | Collect or Intent. |
| Bank Identification Number (BIN) | ✓ | — | Filter only. |
| Amount range | ✓ | — | Filter only, "is between" operator. |
| Custom Identifier | ✓ | ✓ | Up to 3 of your own fields. |
### Download, Duplicate and Export
Every change you make to a view saves automatically and stays saved across sessions. For example, a date range like **last 14 days** is stored as a rolling preset, so the view always shows the latest data when you open it.
### Metrics Supported
The table below lists the metrics you can plot, grouped by category:
| Category | Metric | Definition |
| :---------------- | :---------------------------- | :-------------------------------------------------------------------------------------------------------------------------------------------------------------------------------------------------------- |
| **Success rates** | Payment success rate (%) | Percentage of payment attempts that were successfully authorised. |
| | Order success rate (%) | Percentage of attempted orders that resulted in a successful payment. Each order is counted once, regardless of retries. |
| **Volume** | Payment count (#) | Total payment attempts in the selected period, including retries on the same order. |
| | Order count (#) | Total orders where at least one payment was attempted. Each order is counted once, even if your customer retried the payment. See [Orders](/docs/payments/orders.mdx) and [Payments](/docs/payments.mdx). |
| **Sales** | GMV (₹) | Total value of orders with a payment successfully authorised in the selected period. |
| | Net GMV (₹) | GMV net of refunds for payments in the selected period. |
| | Average transaction value (₹) | GMV divided by total transactions. Shows your average successful payment amount. |
| **Failures** | Payment failure rate (%) | Percentage of payment attempts that failed. |
| | Failed payment count (#) | Number of payment attempts that failed. |
| | Top payment failure reasons | Top 5 most common error reasons across failed payments in the selected period. |
| **Refunds** | Refund rate (%) | Share of payments authorised in the selected period that have been refunded. |
| | Refund count (#) | Refund transactions initiated in the selected period. |
| | Refund amount (₹) | Total value of refunds created in the selected period. Includes failed, pending and processed refunds. |
Order-level metrics take their attributes from the order's latest payment attempt. If a customer tries UPI twice and then pays by card, that order counts as a card payment.
### Filters and Splits
The table below lists the dimensions available as filters and splits:
| Dimension | Filter | Split | Notes |
| :------------------------------- | :----: | :---: | :------------------------------------------- |
| Payment Methods | ✓ | ✓ | — |
| Gateway | ✓ | ✓ | Applicable only for merchants on Optimizer. |
| Channel | ✓ | ✓ | Website, Android and iOS channels supported. |
| Card Type | ✓ | ✓ | — |
| Card Network | ✓ | ✓ | — |
| Card Issuer | ✓ | ✓ | — |
| Netbanking Bank | ✓ | ✓ | — |
| UPI Flow | ✓ | ✓ | Collect or Intent. |
| Bank Identification Number (BIN) | ✓ | — | Filter only. |
| Amount range | ✓ | — | Filter only, "is between" operator. |
| Custom Identifier | ✓ | ✓ | Up to 3 of your own fields. |
### Download, Duplicate and Export
Every change you make to a view saves automatically and stays saved across sessions. For example, a date range like **last 14 days** is stored as a rolling preset, so the view always shows the latest data when you open it.
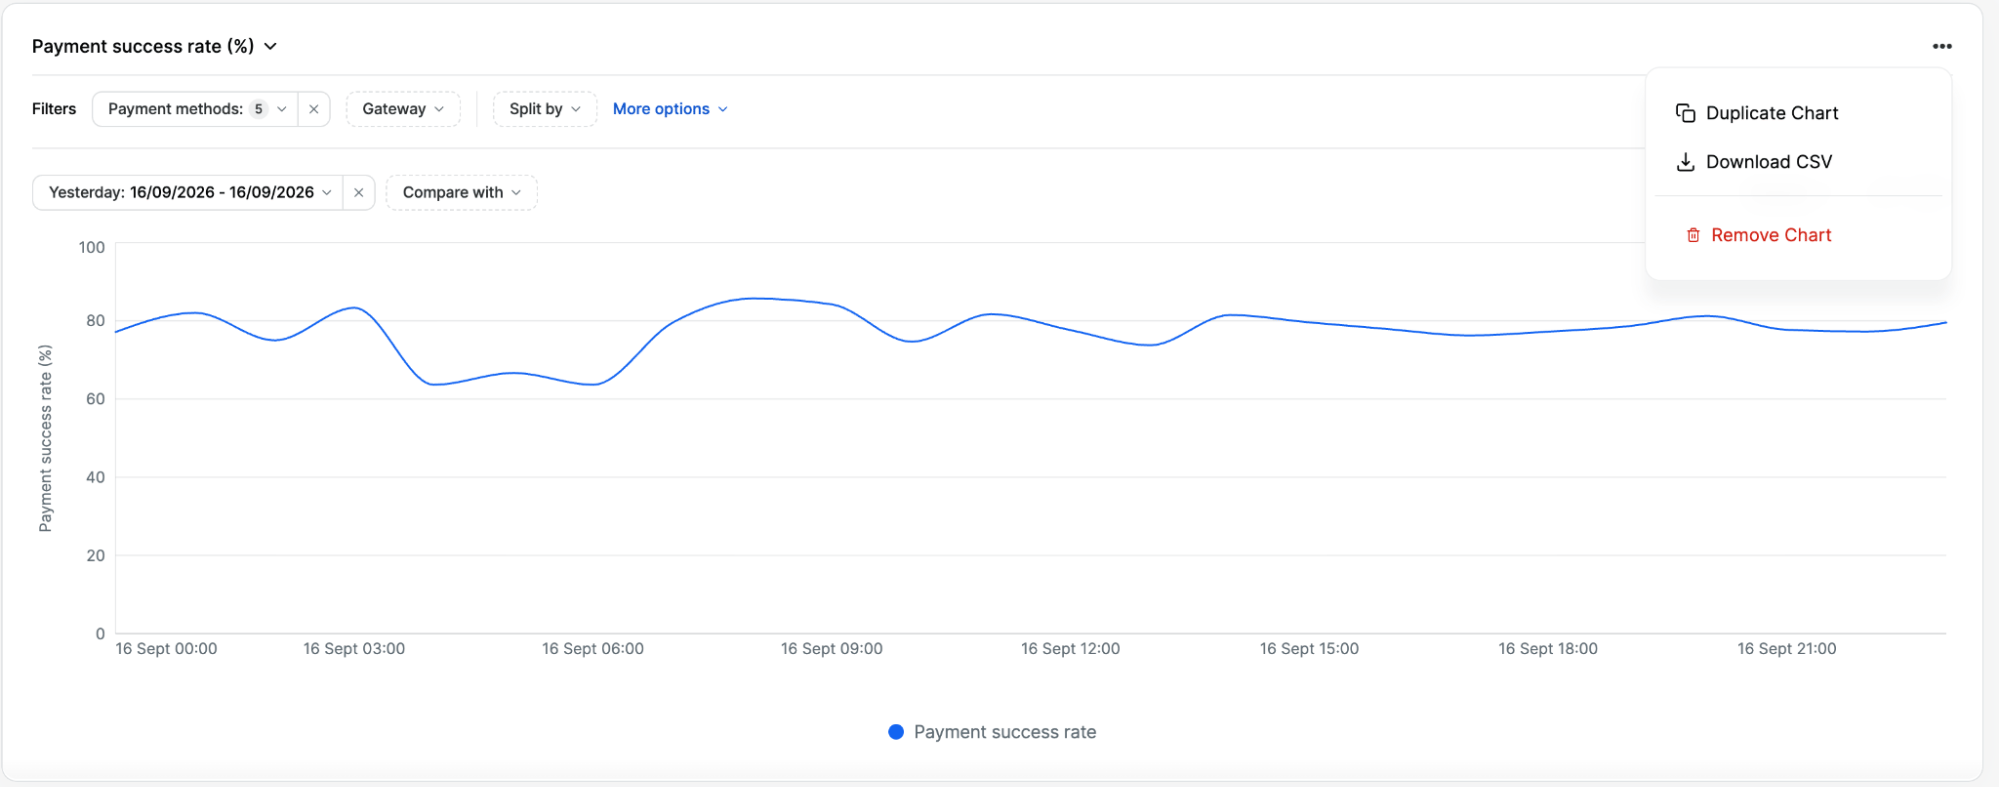 For a view, the following actions are available:
* Rename view
* Duplicate view
* Download view
* Delete view
For a view, the following actions are available:
* Rename view
* Duplicate view
* Download view
* Delete view
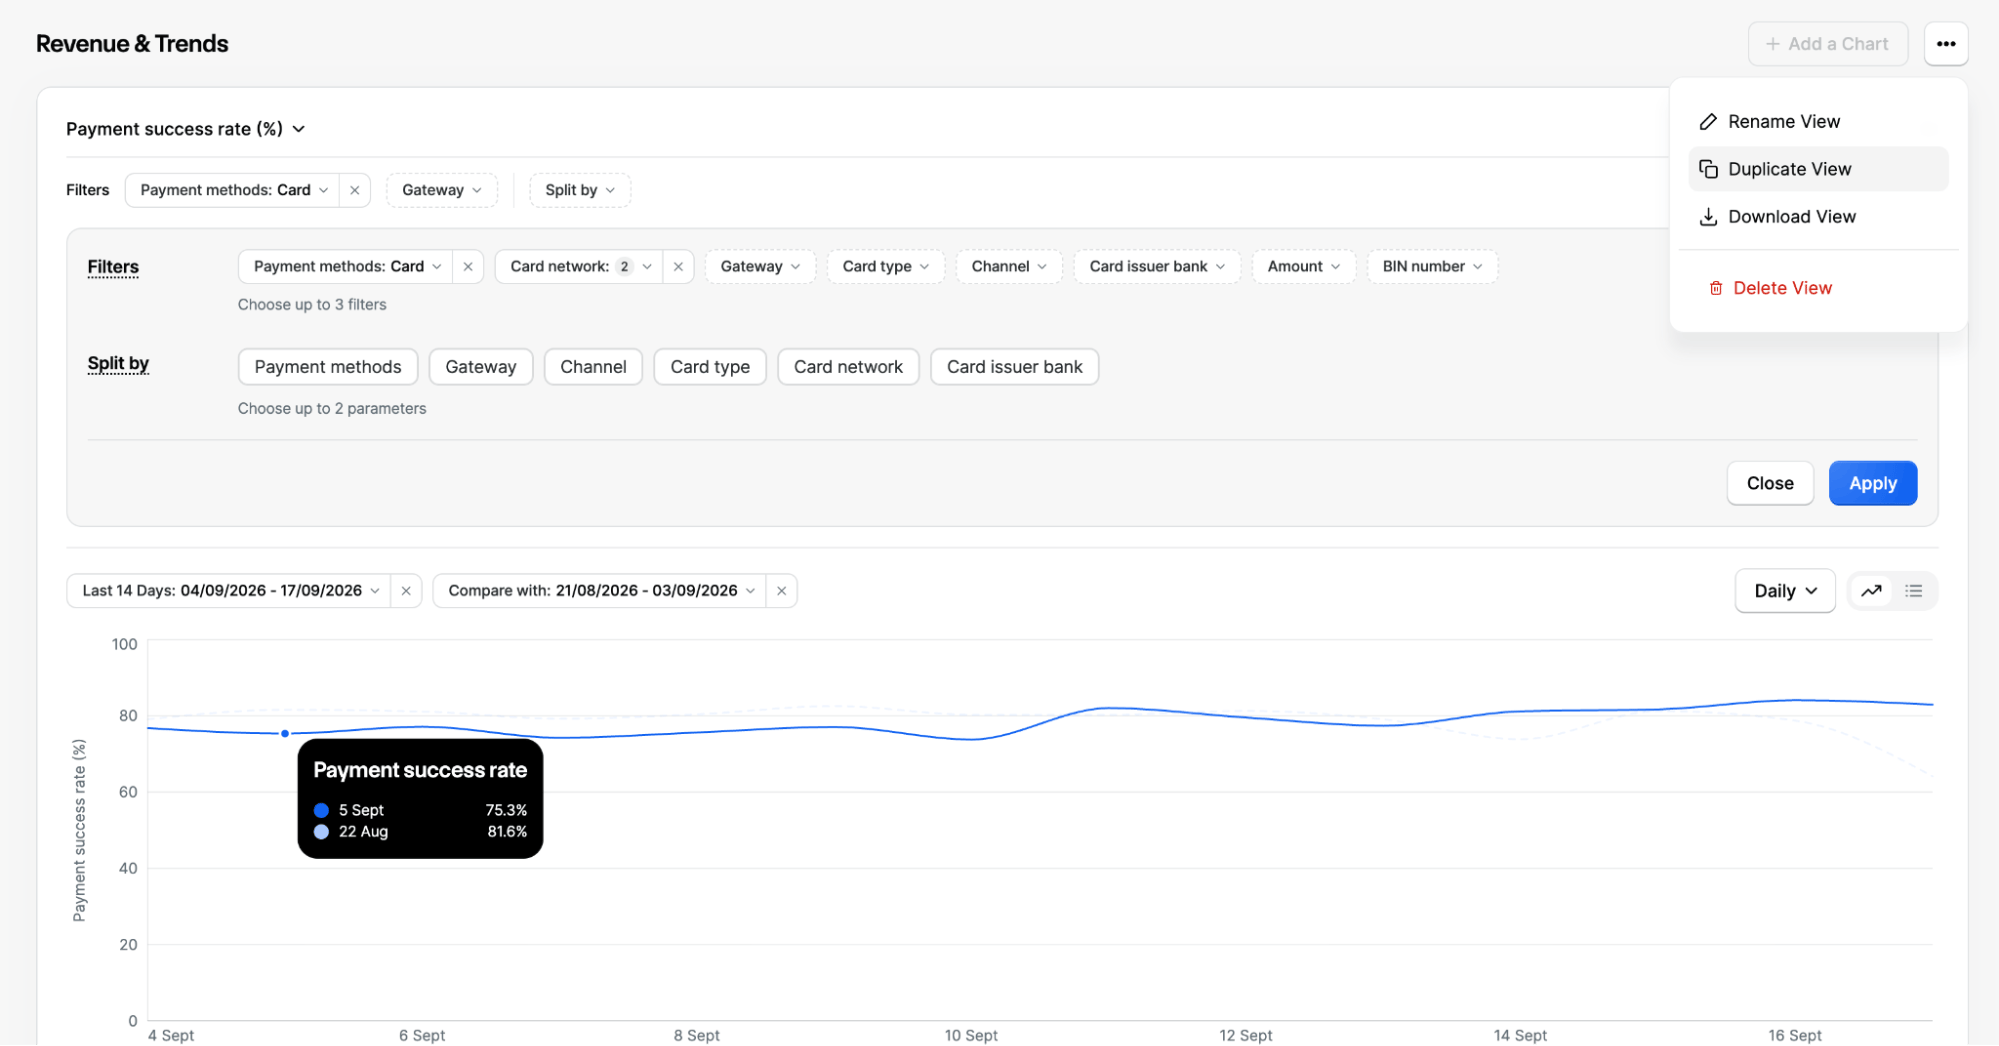 Deleting a view is permanent. Duplicate a view first if you want to keep the original while experimenting with a different view.
### Configuration Limits
| Limit | Value |
| :----------------- | :------------- |
| Saved views | 5 per merchant |
| Charts per view | 3 |
| Filters per chart | 3 |
| Splits per chart | 2 |
| Maximum date range | Up to 90 days |
Deleting a view is permanent. Duplicate a view first if you want to keep the original while experimenting with a different view.
### Configuration Limits
| Limit | Value |
| :----------------- | :------------- |
| Saved views | 5 per merchant |
| Charts per view | 3 |
| Filters per chart | 3 |
| Splits per chart | 2 |
| Maximum date range | Up to 90 days |